Linear Regression in Machine Learning
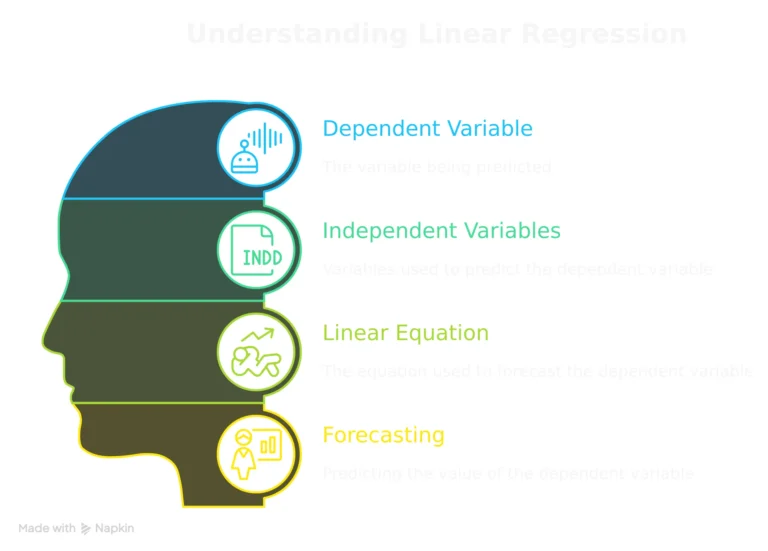
Linear regression is an important statistical method used to analyze/define the relationship between a dependent variable and one or more independent variables. Its main objective is to make a linear equation that can predict the change in dependent variable’s value based on the changes in independent variables’ values. The linear regression equation is:
Y = M1X + C
linear regression equation:
Y=dependent variable, which is the outcome we aim to predict.
X =independent variable, acts as the predictor.
M =Slope of the line (reflects the change in Y for each unit change in X).
C =y-intercept (value of Y when X equals zero).
When more than one predictors are included as factors in multiple linear regression, the equation becomes:
Y = β₀ + β₁X₁ + β₂X₂ + … + βnXn + ϵ
In this Equation:
βᵢ are the coefficients corresponding to each predictor.
ϵ symbolizes the error term.
Predictive Analysis:
An important part of advanced analytics is predictive analysis, which uses statistical algorithms and historical data to predict future occurrences, actions, behaviors and outcomes. This analytical tool helps firms in identifying risks, opportunities, predicting changes and trends, allowing for efficient business planning and informed decision-making.
Ordinary Least Squares (OLS) Method:
The Ordinary Least Squares (OLS) Method is widely used for Linear Regression because of its simplicity, ease of usability and understanding, durability while working with large datasets, theoretical understanding, and accurate output.
Advantages of OLS
Unbiased Estimates (β^): OLS provides uninfluenced coefficient estimates, suggesting that if the study is conducted multiple times, the average will be right.
When all predictors are set to zero, the dependent variable’s starting point is given by the intercept (β₀). It helps you to understand the initial value.
R-squared (R²): This value tells that how well the model is matching with the data. An R² value close to 1 indicates that the model is explaining a significant percentage of the variance in the dependent variable.
Statistical Significance (p): P-values reflect the importance of each predictor present in the model. Lower the p-value (such as less than 0.05), higher is its impact on the outcome.
Interpretability (βᵢ): This coefficient offers a clear understanding of how variables relate to each other. For example, a coefficient with value = 2 means that the dependent variable will increase by two units for every unit increase in the predictor value.
Adjusted R² measures a regression model’s ability to explain data with multiple predictors. It prevents overfitting by penalizing unnecessary variables.
F-statistics checks if the model as a whole is statistically significant, suggesting that at least one predictor has a meaningful connection with the dependent variable.
Diagnostic Tools: Diagnostic tools have residual maps and statistical testing. These are used for checking the model’s assumptions (such as linearity) to ensure your results are valid.
Simplicity: OLS is simple to use and does not require advanced statistical understanding, hence it is widely used method by beginners as well as professionals.
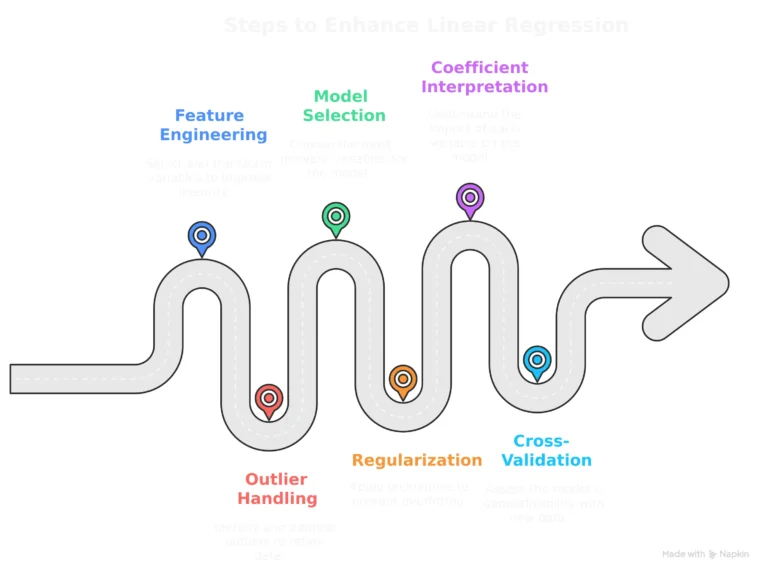
Practical Considerations
Feature Engineering: Feature Engineering includes carefully selecting and transforming the independent variables. This might include adding/creating new variables from existing ones or using transformations (e.g., logarithmic, polynomial) to improve the consistency of the relationship.
Outlier Detection and Handling: Identifying and treating outliers in the data is very important, as they may have a significant impact on the regression results. Methods like removal of outliers, adjusting the data, or applying robust regression algorithms can be considered.
Model Selection: Identifying the most important model factors becomes essential when working with multiple independent variables. Stepwise regression, forward selection, and backward elimination are all methods for identifying the most appropriate subset of variables. Regularization methods like Lasso and Ridge regression are often used to select features without overfitting.
Regularization: Ridge and Lasso regression techniques can help in reducing overfitting, particularly when working with a large number of independent variables. Ridge regression introduces a penalty term to the loss function which is proportional to the square of the coefficients, whereas Lasso regression introduces a penalty term proportional to the coefficients’ absolute values.
- Coefficient Interpretation: Coefficient Interpretation is used to examine the regression model’s coefficients carefully. Always remember that the coefficient for each independent variable signifies the change in the dependent variable that comes from change of one unit in that independent variable, while all other variables remain constant. We have to be careful of the units of measurement and the possibility for variables that may cause misunderstanding.
- Cross-validation: Cross-validation is a technique that is used to evaluate how well the model adapts to fresh data. This involves dividing/splitting the data into multiple folds, training the model on a random subset of them, and then evaluating its performance on the remaining data.